Amazon TACoS: how to work it out and what a healthy figure looks like
The share of all your Amazon sales that you spend on ads is called TACoS (total advertising cost of sale). You work it out as ad spend divided by total sales (from ads plus organic), times 100.
A 10% TACoS means one dollar in every ten you take on Amazon goes back into advertising. Eva Commerce’s study of 150 US brands found a median TACoS of 10.6% from 27 July to 24 October 2026. Each sells one to twenty million dollars a year on Amazon.
| Metric | Divides ad spend by | Answers | Where the sales figure comes from |
|---|---|---|---|
| ACoS | Sales Amazon credits to your ads | Is this campaign efficient? | Your Amazon Ads console |
| TACoS | All your Amazon sales, organic included | What do ads cost the whole business? | Seller Central business reports |
Scroll sideways for all 4 columns

What ACoS and TACoS mean
Most of Amazon’s sponsored ads are PPC (pay-per-click) ads: you pay each time a shopper clicks. ACoS (advertising cost of sale) is Amazon’s own measure of them. Its ACoS guide gives the formula as “ACOS = (ad spend ÷ ad revenue) x 100”.
What is advertising cost of sales (ACOS)?
Advertising cost of sales (ACOS) is a metric that measures ad spend and ad revenue.
Formula ACOS = (ad spend ÷ ad revenue) x 100
Example if you spent $50 on an ad campaign and earned $100 from it, your Amazon ACOS would be 50%.
Profit In order to maintain a profit, your Amazon ACOS needs to be lower than your profit margin.
That guide never mentions TACoS. TACoS is a seller’s metric: you build it yourself from two reports, one for ad spend and one for total sales.
The difference is the bottom of the fraction. ACoS only counts sales Amazon attributes to a click on your ad. TACoS counts every sale, including shoppers who found you in search or came back on their own.

Total sales are normally at least as large as ad sales, so TACoS is normally lower than ACoS. Over a short date range it can flip, because Amazon credits an ad sale up to 7 or 14 days after the click.
The TACoS formula, worked in dollars
Take one month for a single brand:
- You spend $3,000 on sponsored ads.
- Amazon credits those ads with $12,000 of sales.
- Your Business Reports show $40,000 of total sales.
ACoS is 3,000 divided by 12,000, or 25%. TACoS is 3,000 divided by 40,000, or 7.5%.
The two figures are linked. Ads brought in 30% of your sales (12,000 of 40,000), and 25% times 30% gives the same 7.5%. So TACoS equals ACoS multiplied by the share of sales your ads drive. Written out:
TACoS = ACoS × (ad sales ÷ total sales)
In Eva’s sample, ads drove a median 36.3% of total sales, so a 28.4% ACoS works out at about a 10% TACoS (28.4% × 36.3% = 10.3%).
What a rising or falling TACoS tells you
TACoS moves when either ad spend or total sales moves faster than the other. Read it beside both numbers, never alone.
| Ad spend | Total sales | TACoS | What it suggests |
|---|---|---|---|
| Up | Up faster | Falls | Ads lift organic sales too: rank, reviews, repeat buyers |
| Up | Flat | Rises | You buy sales you were already getting, or clicks that do not convert |
| Flat | Down | Rises | Organic sales are slipping: check rank, stock and price |
| Down | Flat | Falls | Spend you cut was not driving sales |
Scroll sideways for all 4 columns
A falling TACoS while you spend more is the result most sellers want. Eva links creator and social content to branded search, which it says “shows up on Amazon as cheaper branded clicks and more organic sales, which is what pulls TACoS down over time.”
A rising TACoS is not always bad. A launch pushes spend ahead of organic sales on purpose, to win rank. The question is whether total sales follow within the months you planned for.
What a healthy TACoS looks like on Amazon
The most detailed dated benchmark is Eva Commerce’s October 2026 study, published on 26 October 2026. It covers 150 US brand accounts Eva works with, over 90 days that include Prime Big Deal Days. Its headline figures are medians, so “one large account cannot move them.”
The middle half of those brands ran a TACoS between 8.1% and 12.8%, with the median at 10.6%. Their median ACoS was 28.4%.
| Category group | Accounts | Median ACoS | Median TACoS |
|---|---|---|---|
| Beauty | 23 | 28.5% | 12.0% |
| Supplements and health | 32 | 28.4% | 11.4% |
| Home and kitchen | 18 | 27.4% | 10.4% |
| Other | 43 | 29.6% | 9.9% |
| Food and drink | 18 | 26.6% | 9.3% |
| Pet | 16 | 28.9% | 8.6% |
| All accounts | 150 | 28.4% | 10.6% |
Scroll sideways for all 4 columns
Size matters too. The smallest band in the study (76 accounts) had a median TACoS of 11.2%. The largest (11 accounts) had 9.7%, even though its ACoS was not lower. Eva calls that top band, eight to twenty million dollars a year, “directional”, because it has only 11 accounts.
Those figures describe what other brands spend, and brands selling under a million dollars a year are not in the sample. Your ceiling comes from your own margin.
Your break-even TACoS is your margin before ads
Profit before ads, divided by total sales, is the highest TACoS you can carry. Above it, ad spend outruns what all your Amazon sales earn before ads, and the account loses money. Say a product sells for $25 and costs $17 once the product, referral fee and FBA fee are paid.
That leaves 8 of 25, a 32% margin before ads. A 32% TACoS breaks even; 10% leaves 22 points of profit; 40% loses money on the whole account, organic sales included.
How to read TACoS per product
One TACoS for the whole account can mix a product that earns with one that burns cash. Work it out for each ASIN (Amazon’s product ID), from two reports:
- Total sales per product: in Seller Central, Business Reports, the sales and traffic report by child item. Amazon’s Sales and Traffic report holds ordered product sales by date and ASIN, at parent, child or SKU level.
- Ad spend per product: the advertised product report in the Amazon Ads console. Amazon’s guide to measuring campaigns lists it for the sales and performance of each advertised product over time.
Use the same date range and the same level in both. Then divide spend by total sales, product by product.
Child ASINs (a size or colour of one listing) show which variant the ads sell. Picture a best seller at 6% beside a new product at 30%: the account average can look healthy while the new one loses money.
Working out TACoS with a calculator
A spreadsheet with the formula above does the job. If you prefer sliders, BidX has a free Enterprise TACoS Calculator that runs in the browser. The BidX profile covers what the paid tool automates and what it costs.
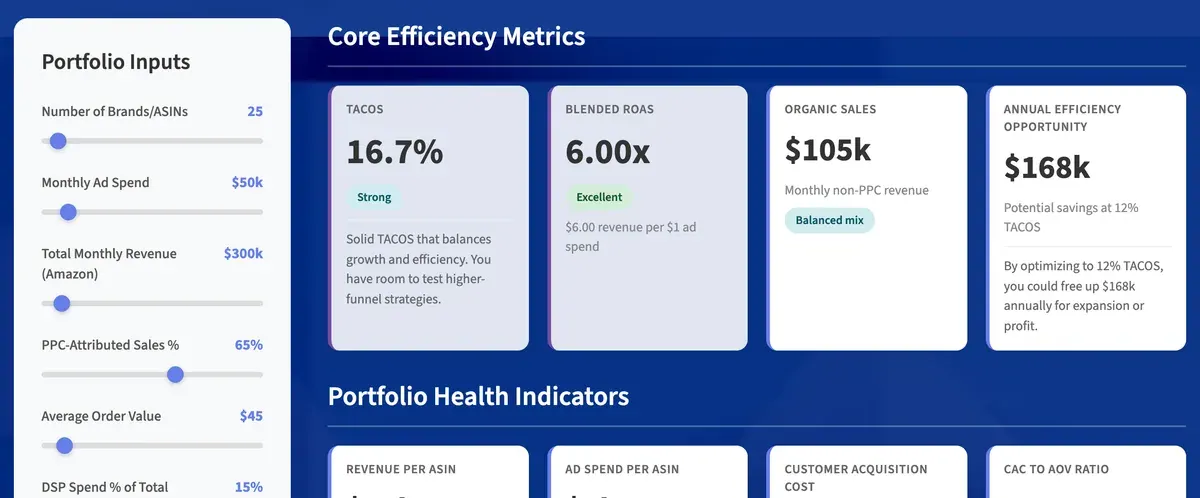
It takes six inputs. The first three are your number of brands or ASINs, monthly ad spend and total monthly Amazon revenue. The others are average order value and the share of sales from PPC. The last is the share of spend on Amazon DSP (Amazon’s display and video ad platform).
It returns TACoS, blended ROAS (revenue over ad spend), organic sales and cost per customer.
The calculator grades your TACoS with BidX’s own bands: under 12% is “Best in Class”, up to 18% “Strong”, up to 25% “Fair” and above that “Needs Attention”. The page says it is built for brands spending $50,000 a month or more on Amazon ads.
The median brand in Eva’s sample, at 10.6%, already sits inside BidX’s “Best in Class” band, and the line sits close to the sample’s upper quartile of 12.8%. So read the bands as a pitch to big spenders. For a benchmark, use Eva’s figures above.
Want software to steer bids towards a TACoS target? Amazon PPC software compares the options.
Questions about Amazon TACoS
What is a good TACoS on Amazon?
Below your margin before ads, first. In Eva Commerce’s October 2026 study of 150 US brands, the median was 10.6% and the middle half ran between 8.1% and 12.8%.
Is TACoS higher or lower than ACoS?
Normally lower. TACoS divides the same ad spend by all your sales, and total sales are normally at least your ad sales.
What is the TACoS formula?
TACoS = ad spend ÷ total Amazon sales × 100. It also equals ACoS multiplied by the share of sales that come from ads.
Is a high TACoS bad?
Not during a launch, when you spend ahead of organic sales to win rank. It is bad when it stays above your margin, or rises while total sales stay flat.
Does Amazon show TACoS?
No ready-made figure in the ACoS guide: you work it out from your ads console spend and your Seller Central total sales.
Sources
- Amazon Ads: What is ACOS? Amazon advertising cost of sales, Defines ACOS as ad spend divided by ad revenue, times 100, and ROAS as its inverse; the guide does not mention TACoS or total sales. Checked
- Eva Commerce: The State of Amazon Ads for $1M to $20M Brands (October 2026), Published 26 October 2026. 150 Amazon US brand accounts Eva works with, 27 July to 24 October 2026, medians by account; TACoS percentiles, by category and by revenue band. Checked
- BidX: Enterprise TACoS Calculator, Six slider inputs, TACoS worked out as monthly ad spend over total monthly Amazon revenue, with BidX’s own bands at 12, 18 and 25 per cent (read from the widget source, recorded in research/data/new-tools-2026-11-09/bidx.json). Checked
- Amazon Selling Partner API: Report type values: analytics (Sales and Traffic report), Ordered product sales and units by date and ASIN, at parent, child or SKU level. Checked
- Amazon Ads: How to measure and improve your campaigns, Lists the advertised product report for sales and performance metrics of each advertised product over time. Checked

Alexandre S.
Alexandre S. is a creative ad strategist and copywriter with ten years' experience in digital marketing across multiple channels.
Related pages
-
 Best list AI ads for Amazon sellers
Amazon’s free AI Video Generator licenses output for Amazon’s own products. Video and image tools whose terms reach Meta and TikTok, checked 2 October 2026.
-
 Guide Amazon product video makers and shoppable video with AI
What Amazon listing and Sponsored Brands videos must meet, what a shoppable video costs from a studio against AI, and which generators fit. Checked 6 Oct 2026.

